图片alt
https://www.ncbi.nlm.nih.gov/pmc/articles/PMC9162052/
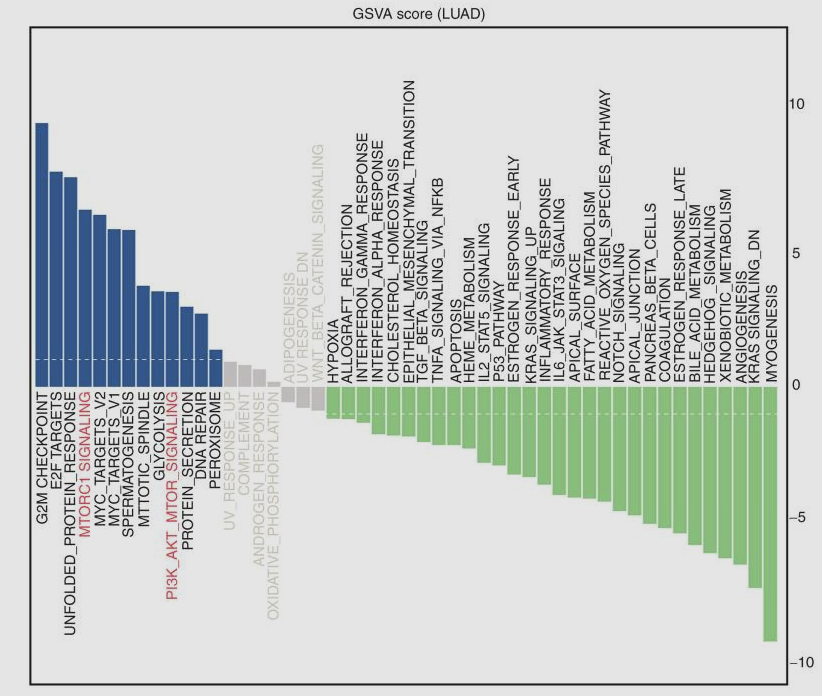
Functional enrichment analysis using GSVA. The y-axis indicates the t-value of the GSVA score.
图片alt
https://www.ncbi.nlm.nih.gov/pmc/articles/PMC9162052/
Functional enrichment analysis using GSVA. The y-axis indicates the t-value of the GSVA score.