- Loading Required R packages
- Preparing the data
- Linear regression
- Polynomial regression
- Log transformation
- Spline regression
- Generalized additive models
- Comparing the models
- reference
在某些情况下,结果和预测变量之间的真正关系可能不是线性的。
为了捕捉这些非线性效应,扩展线性回归模型(Chapter @ref(linear-regression))有不同的解决方案,其中包括:
- Polynomial regression: 这是建立非线性关系的简单方法。它将多项式项或二次项(平方、立方体等)添加到回归中。
- Spline regression: 用一系列多项式段拟合一条光滑曲线。划分
spline段的值称为Knots。 - Generalized additive models (GAM): 拟合自动选择
knots的spline模型。
在本章中,您将学习如何计算非线性回归模型以及如何比较不同的模型以选择适合您数据的最佳模型。
RMSE和R2指标将用于比较不同的模型(see Chapter @ref(linear regression)).
- RMSE代表模型预测误差,这是观察到的结果值和预测结果值的平均差异。
- R2表示观察到的和预测的结果值之间的平方相关性。
最好的模型是最低RMSE和最高R2的模型
Loading Required R packages
- tidyverse for easy data manipulation and visualization
- caret for easy machine learning workflow
library(tidyverse)
library(caret)
theme_set(theme_classic())
Preparing the data
我们将使用Boston数据集[in MASS package], 基于预测变量LSTA (percentage of lower status of the population),用于预测波士顿郊区的房屋价值中值(MDEV)
我们将将数据随机分为训练集(用于构建预测模型的80%)和测试集(评估模型的20%)。确保将种子设置为可重复性。
# Load the data
data("Boston", package = "MASS")
# Split the data into training and test set
set.seed(123)
training.samples <- Boston$medv %>%
  createDataPartition(p = 0.8, list = FALSE)
train.data  <- Boston[training.samples, ]
test.data <- Boston[-training.samples, ]
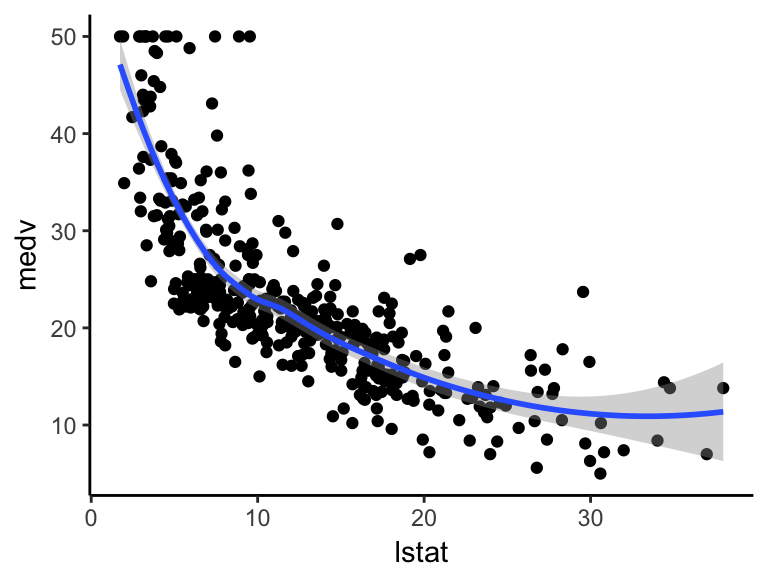
首先,可视化MEDV与LSTAT变量的散点图如下:
ggplot(train.data, aes(lstat, medv) ) +
  geom_point() +
  stat_smooth()

图片alt
上面的散点图表明两个变量之间存在非线性关系
Linear regression
标准线性回归模型方程可以写为MEDV = B0 + B1*LSTAT
计算线性回归模型:
# Build the model
model <- lm(medv ~ lstat, data = train.data)
# Make predictions
predictions <- model %>% predict(test.data)
# Model performance
data.frame(
  RMSE = RMSE(predictions, test.data$medv),
  R2 = R2(predictions, test.data$medv)
)
##   RMSE    R2
## 1 6.07 0.535
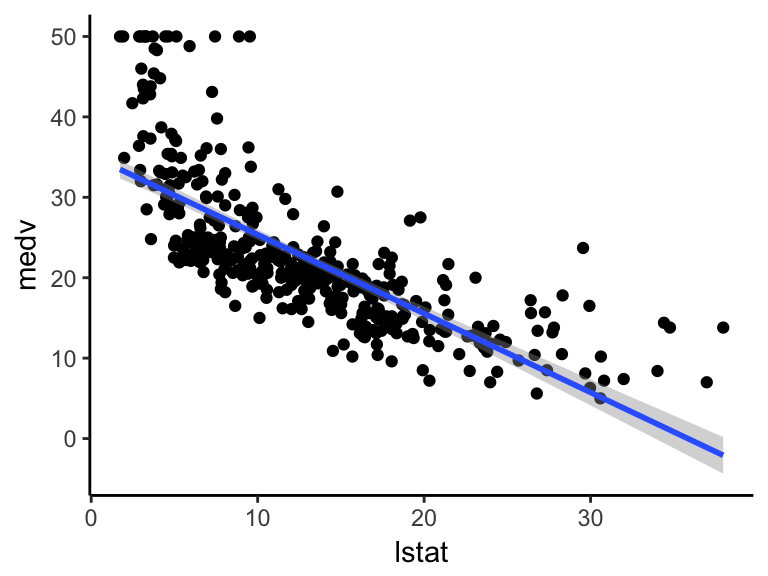
可视化数据:
ggplot(train.data, aes(lstat, medv) ) +
  geom_point() +
  stat_smooth(method = lm, formula = y ~ x)

图片alt
Polynomial regression
多项式回归在回归方程中添加多项式或二次项,如下:
medv = b0+b1*lstat+b2*lstat^2
在r中,要创建一个预测变量x^2,您应该使用函数I(),如下:I(x^2)。把 x 提高到2的幂次方
多项式回归可以在R中计算如下:
lm(medv ~ lstat + I(lstat^2), data = train.data)
另一种简单的解决方案是使用以下方式:
lm(medv ~ poly(lstat, 2, raw = TRUE), data = train.data)
## Call:
## lm(formula = medv ~ poly(lstat, 2, raw = TRUE), data = train.data)
##
## Coefficients:
##                 (Intercept)  poly(lstat, 2, raw = TRUE)1
##                     42.5736                      -2.2673
## poly(lstat, 2, raw = TRUE)2
##                      0.0412
该输出包含与LSTAT相关的两个系数:一个用于线性项 (lstat^1),一个用于二次项(lstat^2)。
以下示例计算六阶多项式拟合:
lm(medv ~ poly(lstat, 6, raw = TRUE), data = train.data) %>%
  summary()
# # Call:
# #   lm(formula = medv ~ poly(lstat, 6, raw = TRUE), data = train.data)
# #
# # Residuals:
# #   Min       1Q   Median       3Q      Max
# # -13.1962  -3.1527  -0.7655   2.0404  26.7661
# #
# # Coefficients:
# #   Estimate Std. Error t value Pr(>|t|)
# # (Intercept)                  7.788e+01  6.844e+00  11.379  < 2e-16 ***
# #   poly(lstat, 6, raw = TRUE)1 -1.767e+01  3.569e+00  -4.952 1.08e-06 ***
# #   poly(lstat, 6, raw = TRUE)2  2.417e+00  6.779e-01   3.566 0.000407 ***
# #   poly(lstat, 6, raw = TRUE)3 -1.761e-01  6.105e-02  -2.885 0.004121 **
# #   poly(lstat, 6, raw = TRUE)4  6.845e-03  2.799e-03   2.446 0.014883 *
# #   poly(lstat, 6, raw = TRUE)5 -1.343e-04  6.290e-05  -2.136 0.033323 *
# #   poly(lstat, 6, raw = TRUE)6  1.047e-06  5.481e-07   1.910 0.056910 .
# # ---
# #   Signif. codes:  0 ‘***’ 0.001 ‘**’ 0.01 ‘*’ 0.05 ‘.’ 0.1 ‘ ’ 1
# #
# # Residual standard error: 5.188 on 400 degrees of freedom
# # Multiple R-squared:  0.6845,	Adjusted R-squared:  0.6798
# # F-statistic: 144.6 on 6 and 400 DF,  p-value: < 2.2e-16
从上面的输出可以看出,超出第五阶以上的多项式项并不重要。因此,只需创建第五个多项式回归模型如下:
# Build the model
model <- lm(medv ~ poly(lstat, 5, raw = TRUE), data = train.data)
# Make predictions
predictions <- model %>% predict(test.data)
# Model performance
data.frame(
  RMSE = RMSE(predictions, test.data$medv),
  R2 = R2(predictions, test.data$medv)
)
##       RMSE        R2
## 1 5.270374 0.6829474
可视化第五多项式回归线,如下:
ggplot(train.data, aes(lstat, medv) ) +
  geom_point() +
  stat_smooth(method = lm, formula = y ~ poly(x, 5, raw = TRUE))

图片alt
Log transformation
当您有非线性关系时,您也可以尝试对预测变量的对数转换:
# Build the model
model <- lm(medv ~ log(lstat), data = train.data)
# Make predictions
predictions <- model %>% predict(test.data)
# Model performance
data.frame(
  RMSE = RMSE(predictions, test.data$medv),
  R2 = R2(predictions, test.data$medv)
)
##      RMSE        R2
## 1 5.467124 0.6570091
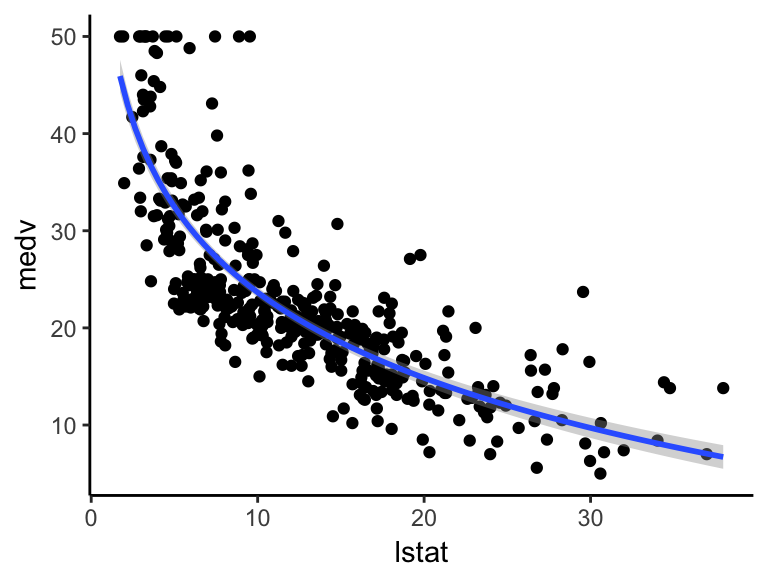
可视化数据:
ggplot(train.data, aes(lstat, medv) ) +
  geom_point() +
  stat_smooth(method = lm, formula = y ~ log(x))

图片alt
Spline regression
多项式回归仅在非线性关系中捕获一定数量的曲率。建模非线性关系的一种替代方法是使用splines (P. Bruce and Bruce 2017).Splines提供一种在固定点之间平稳插值的方法,称为knots。多项式回归是在knots之间计算的。换句话说,splines是一系列多项式段串在一起,加入knots (P. Bruce and Bruce 2017)。
R软件包splines包括用于在回归模型中创建b-spline项的函数bs。
您需要指定两个参数:the degree of the polynomial和the location of the knots。在我们的示例中,我们将knots放在下四分位数,中值四分位数和上四分位数。
knots <- quantile(train.data$lstat, p = c(0.25, 0.5, 0.75))
我们将使用立方spline(degree= 3)创建模型:
library(splines)
# Build the model
knots <- quantile(train.data$lstat, p = c(0.25, 0.5, 0.75))
model <- lm (medv ~ bs(lstat, knots = knots), data = train.data)
# Make predictions
predictions <- model %>% predict(test.data)
# Model performance
data.frame(
  RMSE = RMSE(predictions, test.data$medv),
  R2 = R2(predictions, test.data$medv)
)
##   RMSE    R2
## 1 4.97 0.688
请注意,spline术语的系数是不可解释的。
将三次spline曲线可视化如下:
ggplot(train.data, aes(lstat, medv) ) +
  geom_point() +
  stat_smooth(method = lm, formula = y ~ splines::bs(x, df = 3))

图片alt
Generalized additive models
一旦您发现数据中的非线性关系,多项式项可能不足以捕获这种关系,并且spline项需要指定knots。
Generalized additive models(GAM)是一种自动拟合spline回归的技术。这可以使用mgcv R package:
library(mgcv)
# Build the model
model <- gam(medv ~ s(lstat), data = train.data)
# Make predictions
predictions <- model %>% predict(test.data)
# Model performance
data.frame(
  RMSE = RMSE(predictions, test.data$medv),
  R2 = R2(predictions, test.data$medv)
)
##   RMSE    R2
## 1 5.02 0.684
s(lstat)告诉gam()函数,以找到spline的“最佳”knots。
可视化数据:
ggplot(train.data, aes(lstat, medv) ) +
  geom_point() +
  stat_smooth(method = gam, formula = y ~ s(x))

图片alt
Comparing the models
从分析不同模型的RMSE和R2指标,可以看出,多项式回归,spline回归和generalized additive models的表现优于线性回归模型和对数转换方法。
reference
- http://www.sthda.com/english/articles/40-regression-analysis/162-nonlinear-regression-essentials-in-r-polynomial-and-spline-regression-models
- Bruce, Peter, and Andrew Bruce. 2017. Practical Statistics for Data Scientists. O’Reilly Media.