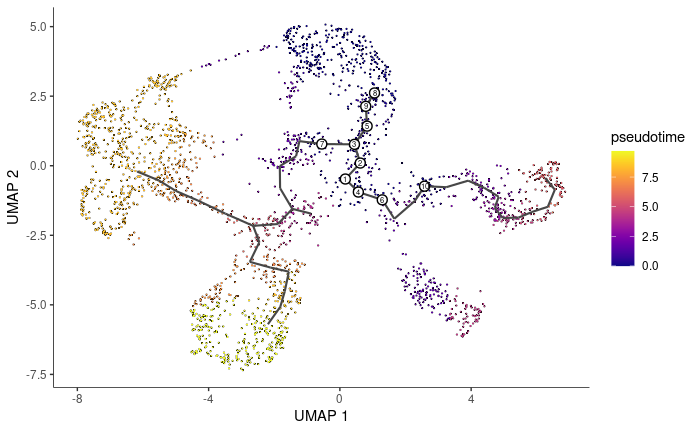
Pseudotime is a measure of how much progress an individual cell has made through a process such as cell differentiation. In many biological processes, cells do not progress in perfect synchrony. In single-cell expression studies of processes such as cell differentiation, captured cells might be widely distributed in terms of progress. That is, in a population of cells captured at exactly the same time, some cells might be far along, while others might not yet even have begun the process. This asynchrony creates major problems when you want to understand the sequence of regulatory changes that occur as cells transition from one state to the next. Tracking the expression across cells captured at the same time produces a very compressed sense of a gene's kinetics, and the apparent variability of that gene's expression will be very high. By ordering each cell according to its progress along a learned trajectory, Monocle alleviates the problems that arise due to asynchrony. Instead of tracking changes in expression as a function of time, Monocle tracks changes as a function of progress along the trajectory, which we term pseudotime''. Pseudotime is an abstract unit of progress: it's simply the distance between a cell and the start of the trajectory, measured along the shortest path. The trajectory's total length is defined in terms of the total amount of transcriptional change that a cell undergoes as it moves from the starting state to the end state.
load("/data3/wangyang/scrna_alignment/raw_data/pit_endo_07_25_pc14_res1.5_seurat.Robj")
pbmc<-UpdateSeuratObject(pit.endo) #convert seurat2 to seurat3+
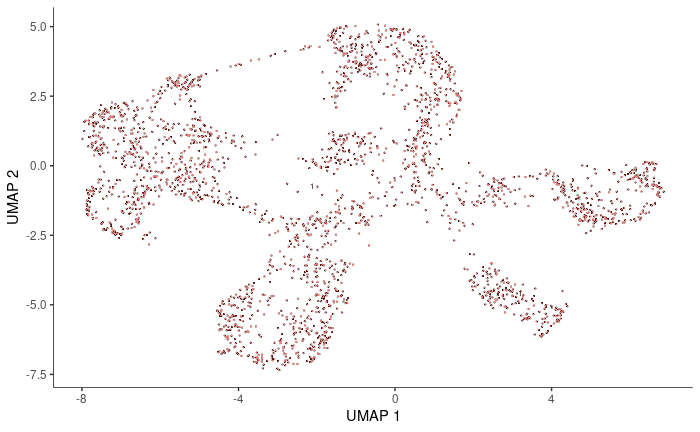
DimPlot(pbmc, reduction = "umap")
cds <- as.cell_data_set(pbmc)
cds <- cluster_cells(cds)
class(cds)
head(pData(cds))
plot_cells(cds, color_cells_by = "partition", show_trajectory_graph = FALSE)
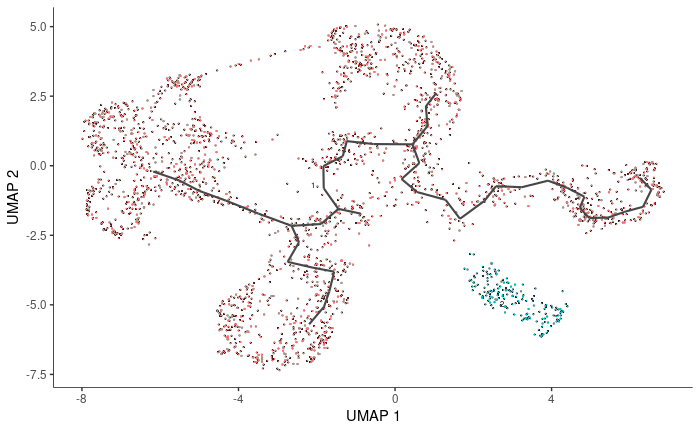
cds <- learn_graph(cds)
plot_cells(cds, label_groups_by_cluster = FALSE, label_leaves = FALSE, label_branch_points = FALSE)
stem1<-rownames(pData(cds)[which(pData(cds)$subcluster %in% c('Stem1')),])
cds <- order_cells(cds, root_cells = stem1)
plot_cells(cds, color_cells_by = "pseudotime", label_cell_groups = FALSE, label_leaves = FALSE,
    label_branch_points = FALSE)
图片alt