R代码实现
Getting started
library(survival)
?lung
- time: Survival time in days
- status: censoring status 1=censored, 2=dead
Survival Curves
The status indicator, normally 0=alive, 1=dead.
Other choices are TRUE/FALSE (TRUE = death) or 1/2 (2=death).
For interval censored data, the status indicator is 0=right censored, 1=event at time, 2=left censored, 3=interval censored. For multiple endpoint data the event variable will be a factor, whose first level is treated as censoring. Although unusual, the event indicator can be omitted, in which case all subjects are assumed to have an event.
s <- Surv(lung$time, lung$status)
sfit <- survfit(Surv(time, status)~1, data=lung)
summary(sfit)
Call: survfit(formula = Surv(time, status) ~ 1, data = lung)

 time n.risk n.event survival std.err lower 95% CI upper 95% CI
    5    228       1   0.9956 0.00438       0.9871        1.000
   11    227       3   0.9825 0.00869       0.9656        1.000
   12    224       1   0.9781 0.00970       0.9592        0.997
   13    223       2   0.9693 0.01142       0.9472        0.992
   15    221       1   0.9649 0.01219       0.9413        0.989
   26    220       1   0.9605 0.01290       0.9356        0.986
   30    219       1   0.9561 0.01356       0.9299        0.983
   31    218       1   0.9518 0.01419       0.9243        0.980
   53    217       2   0.9430 0.01536       0.9134        0.974
   54    215       1   0.9386 0.01590       0.9079        0.970
sfit <- survfit(Surv(time, status)~sex, data=lung)
summary(sfit, times=seq(0, 1000, 100))
Call: survfit(formula = Surv(time, status) ~ sex, data = lung)

                sex=1
 time n.risk n.event survival std.err lower 95% CI upper 95% CI
    0    138       0   1.0000  0.0000       1.0000        1.000
  100    114      24   0.8261  0.0323       0.7652        0.892
  200     78      30   0.6073  0.0417       0.5309        0.695
  300     49      20   0.4411  0.0439       0.3629        0.536
  400     31      15   0.2977  0.0425       0.2250        0.394
  500     20       7   0.2232  0.0402       0.1569        0.318
  600     13       7   0.1451  0.0353       0.0900        0.234
  700      8       5   0.0893  0.0293       0.0470        0.170
  800      6       2   0.0670  0.0259       0.0314        0.143
  900      2       2   0.0357  0.0216       0.0109        0.117
 1000      2       0   0.0357  0.0216       0.0109        0.117

                sex=2
 time n.risk n.event survival std.err lower 95% CI upper 95% CI
    0     90       0   1.0000  0.0000       1.0000        1.000
  100     82       7   0.9221  0.0283       0.8683        0.979
  200     66      11   0.7946  0.0432       0.7142        0.884
  300     43       9   0.6742  0.0523       0.5791        0.785
  400     26      10   0.5089  0.0603       0.4035        0.642
  500     21       5   0.4110  0.0626       0.3050        0.554
  600     11       3   0.3433  0.0634       0.2390        0.493
  700      8       3   0.2496  0.0652       0.1496        0.417
  800      2       5   0.0832  0.0499       0.0257        0.270
  900      1       0   0.0832  0.0499       0.0257        0.270
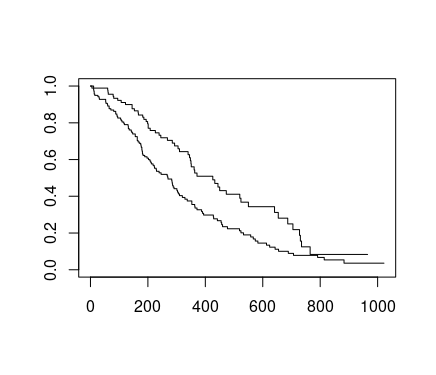
From these tables we can start to see that males tend to have worse survival than females.
plot(sfit)
?plot.survfit

图片alt
library(survminer)
ggsurvplot(sfit)

图片alt
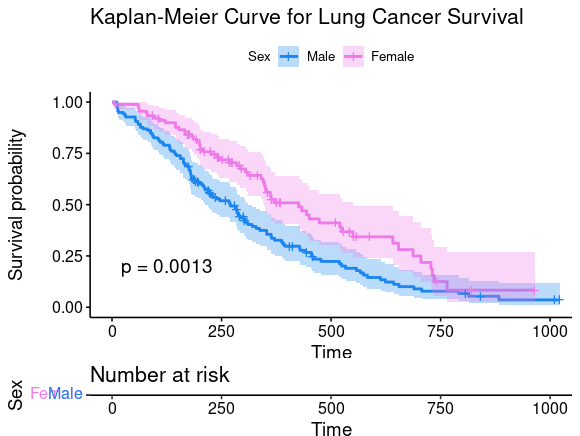
ggsurvplot(sfit, conf.int=TRUE, pval=TRUE, risk.table=TRUE,
           legend.labs=c("Male", "Female"), legend.title="Sex",
           palette=c("dodgerblue2", "orchid2"),
           title="Kaplan-Meier Curve for Lung Cancer Survival",
           risk.table.height=.15)

图片alt
Let’s add confidence intervals, show the p-value for the log-rank test, show a risk table below the plot, and change the colors and the group labels.
diff <- survdiff(formula,data = expr)
pVal <- 1 -pchisq(diff$chisq,df =1)
pValue <- signif(pVal,4)
正规化Cox回归
glmnet使用Breslow approximation处理生存时间的关系。这与survival package’s coxph函数不同,后者的默认tie-handling method是Efron approximation。
# create x matrix
set.seed(1)
nobs <- 100; nvars <- 15
x <- matrix(rnorm(nobs * nvars), nrow = nobs)

# create response
ty <- rep(rexp(nobs / 5), each = 5)
tcens <- rbinom(n = nobs, prob = 0.3, size = 1)
y <- Surv(ty, tcens)

# coefficients from these two models will not line up because
# of different tie handling methods
glmnet_fit <- glmnet(x, y, family = "cox", lambda = 0)
coxph_fit <- coxph(y ~ x)
plot(coef(glmnet_fit), coef(coxph_fit))
abline(0, 1)
> coxph_fit
Call:
coxph(formula = y ~ x)

        coef exp(coef) se(coef)      z       p
x1   0.05039   1.05169  0.21966  0.229 0.81854
x2  -0.16417   0.84860  0.20029 -0.820 0.41240
x3   0.44732   1.56412  0.19542  2.289 0.02208
x4  -0.32146   0.72509  0.21657 -1.484 0.13773
x5  -0.03365   0.96691  0.13810 -0.244 0.80751
x6   0.19536   1.21574  0.20934  0.933 0.35073
x7   0.22255   1.24926  0.18222  1.221 0.22197
x8  -0.20540   0.81432  0.19706 -1.042 0.29725
x9   0.05330   1.05475  0.24046  0.222 0.82456
x10  0.40321   1.49663  0.20686  1.949 0.05127
x11  0.32410   1.38279  0.20433  1.586 0.11270
x12  0.02223   1.02248  0.20695  0.107 0.91447
x13 -0.27625   0.75863  0.19000 -1.454 0.14596
x14  0.03746   1.03817  0.26100  0.144 0.88588
x15  0.68355   1.98089  0.23627  2.893 0.00381

Likelihood ratio test=21.55  on 15 df, p=0.1202
n= 100, number of events= 33
> glmnet_fit

Call:  glmnet(x = x, y = y, family = "cox", lambda = 0)

  Df  %Dev Lambda
1 15 10.39      0

图片alt
glmnet目前无法执行
Efron approximation。survival的coxph可以通过指定ties = "breslow"来执行Breslow approximation:
# coefficients from these two models will line up
glmnet_fit <- glmnet(x, y, family = "cox", lambda = 0)
coxph_fit <- coxph(y ~ x, ties = "breslow")
plot(coef(glmnet_fit), coef(coxph_fit))
abline(0, 1)

图片alt
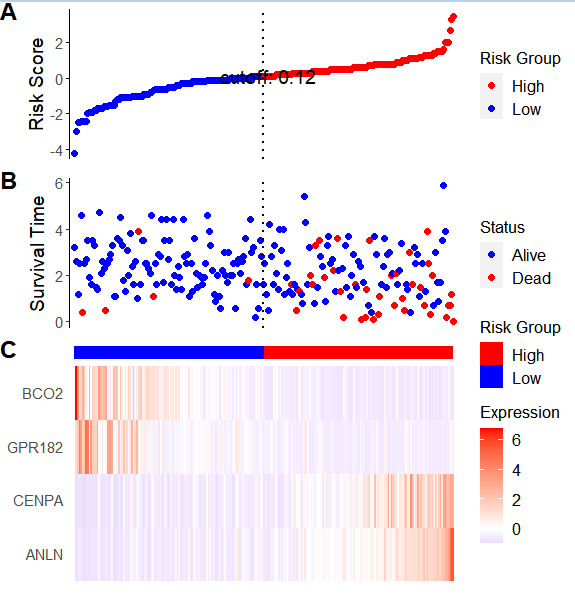
ggrisk 高效绘制风险因子联动图

图片alt
常见问题
- Time variable is not numeric
- Invalid status value, must be logical or numeric
  mutate(Overall_Survival_Status = as.numeric(Overall_Survival_Status),
         days_to_last_followup=as.numeric(days_to_last_followup))